We know from previous
chapters how to graph polynomial functions of degrees 0, 1, and 2. In this
section we are learning about how to graph and sketch polynomial functions of
higher degrees.
Here are the basics,
Even functions are functions that the highest
power is divisible by 2. (ex. 2, 4, 18, 228,
etc.)
Odd functions are functions in which the highest power
is not divisible
by 2. (ex. 3, 17, 769 etc.)
The
graph of a polynomial function is continuous,
meaning both ends of the graph stretch out to infinity in their respective
directions.
This
also means that there are no breaks, holes, gaps, or sharp turns in the
graph.
The
number of turns a graph has can be determined by the highest degree. Whatever
the highest degree is is how many turns the graph will take.
Even
degrees do not have to cross the x-axis, odd degrees do.
A
function to the nth degree will have n-1 extremes (ex,.gif) will have 4 extremes, either maximums and
minimums)
will have 4 extremes, either maximums and
minimums)
.gif) will have 4 extremes, either maximums and
minimums)
will have 4 extremes, either maximums and
minimums)
An “nth”
degree will have “n” x-intercepts at most, it can have less but not more.
End Behavior
If the
leading coefficient (number with the highest power) is odd,
the ends both go in different directions. An
example of an odd function would be:
The graph
of an odd function would look like this…

Whether or not the leading coefficient is negative or positive affects the graph as well. In the graph above, the leading coefficient is positive and the ends are directly affected by it.
If an odd function’s
coefficient is positive, the left end
will always go into negative infinity and the right end will always go up into
positive infinity.
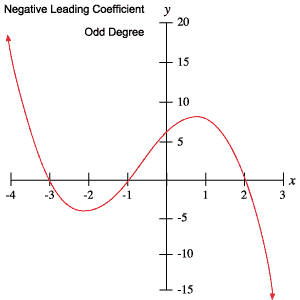
Oppositely, if an odd
function’s coefficient is negative, the left end
will go up into positive infinity and the right end will go down into negative
infinity.
The
graph of this would look like:

The proper notation of a graph’s end behavior would be:
Right Side:
A
function with an even leading coefficient has both
its ends going in the same direction, regardless of how big or small the
degree is.
Similar
to the previous odd function, an even function’s end behavior is also affected by
the leading coefficient’s either positivity or negativity.
A positive, even
function would look like this with both ends going
up

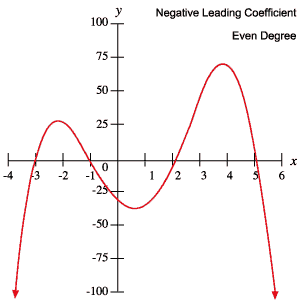
An even function with a
negative leading coefficient would look like this, with the ends
pointing down
Repeated Roots of Multiplicity
Its
graph will look something like this:
http://t0.gstatic.com/images?q=tbn:ANd9GcSAId74MEOU_uoNQoDAo0KlHKeoB1pyZWmG9c2GEYRExPqVfhxqSg
The
connection that can be made here is that if you have a part of your function
that is squared, giving it two zeroes, that part of the graph does not cross
the x-axis, but instead just touches it. Like a tangent.
The graph will look like
this:
http://t2.gstatic.com/images?q=tbn:ANd9GcS2l1zFCCPKv8dw8INjcVPAEM9QuUZFlL6exbvFJcxcRR7_iiCx
The graph will look like
the graph of.gif) for that portion, then continue to do whatever it wants to do
after that.
for that portion, then continue to do whatever it wants to do
after that.
.gif) for that portion, then continue to do whatever it wants to do
after that.
for that portion, then continue to do whatever it wants to do
after that..gif)
.gif)
.gif)
.gif)

.gif)

No comments:
Post a Comment